How to Prepare Donor Data Reports for Your Board Members




Your donors fuel your organization’s work, so it’s crucial to maintain a healthy, thriving base of supporters. A major part of connecting with these individuals and optimizing the giving experience is utilizing the data you collect about their giving trends to inform your future fundraising decisions.
Luckily, ongoing advancements in fundraising software allow you to seamlessly collect the donor data you need. In this post, we’ll talk about why this is incredibly useful for board members who want to hone in on donor engagement. We’ll explore these topics to help you prepare your reports so board members can easily understand them:
- The role of the board in donor management
- Information to include in your donor report
- Donor data to exclude from your report
- How to present donor data to your board
- Frequently asked questions about donor data reports for board members
There’s a reason each of your board members is in a leadership position at your organization. Giving them the resources and data they need to effectively analyze your fundraising performance will empower them to help your organization to the fullest extent.
What role does your board play in donor management?
Great question! At most organizations, board members play a direct role in fundraising—whether that’s sending donation appeals, participating in events, meeting face-to-face with major donors, or expressing gratitude after a donation is made. With their direct involvement, they must understand which donor management tactics are working, which are falling short, and your organization's overall financial situation. A major part of this is understanding and leveraging data to inform any changes they make to the donor experience.
As a fundraising coordinator who prepares these reports, you work with this data every day. However, most board members aren’t familiar with various fundraising metrics and won’t be able to draw effective conclusions when they’re presented with data without an explanation of what the data shows.
Between balancing their personal and professional lives and strategizing how to put your organization on the best path forward, your board is incredibly busy. The last thing you want to do is waste their time and bog their donor reports down with unnecessary metrics.
Information to include in your donor report
In many cases, you’ll only have a short amount of time to present your donor data report, so it’s critical to spend time discussing the most important key performance indicators. This means giving the board an overview of your fundraising performance. Doing so can be as simple as sharing a chart with these metrics from the past year:
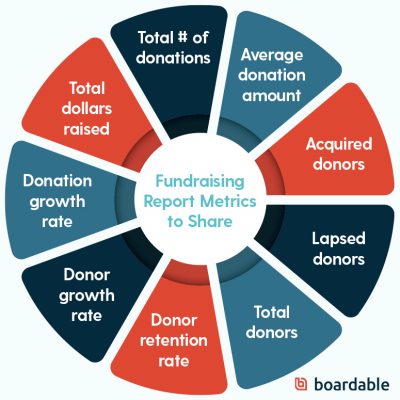
- Total dollars raised: overall dollars acquired through fundraising initiatives
- Total number of donations: the number of donations that were made
- Average donation amount: the average gift size received from a donor (Sum of donations $ ÷ Total # of Donations = Average Donation Amount)
- Acquired donors: the number of first-time donors who made a gift to your organization
- Total donors: the number of individuals who donated to your organization
- Donor retention rate: the percentage of donors who gave to your organization last year and this year (Returning Donors in Year #2 ÷ All Donors in Year #1)
- Donor growth rate: the percentage increase in the total number of donors compared to the previous year
- Donation growth rate: the increase in donation revenue compared to the previous year
- Lapsed donors: the percentage of donors who gave to your organization last year but not this year
The report should include enough information to convey successes (and any shortcomings) you’ve had throughout the past year. To indicate growth, include last year’s numbers and the percent change in your presentation. This will provide a frame of reference for this year’s performance in comparison to the previous year, allowing your board to pinpoint key areas they should focus on going forward.
Double the Donation’s nonprofit CRM guide explains that a robust database will make it incredibly easy to track progress within your database. This will help you measure improvement year-over-year and hold your team accountable for meeting various goals. Then, you can just as easily organize this information in a customized report when the time comes to analyze and share it.
Should you use the mean or the median for the average gift size?
For a quick refresher, the mean is the sum of all values divided by the number of values. On the other hand, the median is the middle value in a set of numbers, meaning 50% of donors give less and 50% give more.
Unlike the mean, the median cuts through the noise of outliers—those extra-large or extra-small donations—and gives you a true middle ground. Using the median is a much more reliable tool for:
- Understanding your donor base’s typical giving level
- Setting realistic fundraising goals
- Accurately forecasting future revenue
Additional information to share
Go a step further with your donor report by providing a breakdown of where funding has come from. For instance, list out the different fundraising initiatives you’ve conducted and note the total dollars raised from each of those. You could include categories such as events, social fundraisers, and bequests. This breakdown will help board members grasp where you’re experiencing growth and what efforts you can divert attention away from.
Include a final section that focuses on donor relations. What organizational projects, marketing efforts, and fundraising initiatives have helped deepen donor relationships over the past year? Talk about where your board and staff members have excelled in their efforts, such as if they have proactively reached out with donor thank you letters or spent time meeting with major donors one-on-one. That way, they’ll understand what practices to continue and which to taper off.
Donor data to exclude from your report
While putting enough information in your fundraising report is crucial, it’s just as important to understand what not to include in your presentation. Remember, you likely won’t have a ton of time to present this information, so it doesn’t make sense to include every minute detail.
Three pieces of information to steer clear of include:
- Advanced metrics. Board members will likely lose interest if the metrics and concepts you discuss aren’t crystal clear. Exclude advanced metrics such as donor lifetime value, donor acquisition cost, and trends in recaptured donors. Not only could including this information confuse and bore board members, but it could also quickly become a time-suck if they ask for an explanation of how the metrics are collected or calculated.
- Predictive analytics. It can be tempting to dedicate a couple of slides to discuss your wealth screening and other predictive modeling results. While board members may find inferences about future donor behavior interesting, predictive analytics should be presented as probability ranges, not guaranteed outcomes. You don’t want to mislead them or get their hopes up, especially if they fixate on these numbers and think of them as guaranteed outcomes.
- All fundraising successes. Spending the entire time running down a list of your organization’s wins might feel good, but it doesn’t necessarily provide the most valuable information. Rather, stick to a few major takeaways or trends, so you have time to focus on what’s most important.
As Boardable’s guide to board engagement explains, your organization’s mission and programs may be their primary interest, but understanding the health of your organization’s fundraising is critical to their success. After all, you can’t pursue your mission or run programs without fundraising. Overloading board members with irrelevant data can quickly overwhelm and disinterest them, so boil it down to the most important information.
How to present donor data to your board
To effectively prepare for your presentation, anticipate some of the questions your board members might ask. Expect these three general questions from your board members:
- What does this data mean? Everyone must understand what your data means and how it plays into your organization’s strategic planning. If you’re unsure about the data you’re sharing and whether it’s accurate, you should instead focus on cleaning up the organization’s database before presenting data you don’t understand.
- How do our metrics compare to those of other organizations in our space or area? Consider any publicly available information regarding similarly-sized organizations and those that pursue similar causes. Some online resources gather universal data regarding all nonprofit fundraising that you can use to compare your organization’s metrics to, like on a Fundraising Report Card.
- What are we going to do next based on this information? Give some forethought into potential next steps your organization can take to improve your key fundraising metrics. Have high-level ideas ready, like setting up a new email welcome series to boost first-time donor acquisition rates or increasing follow-up efforts to ensure monthly donors follow through with their payments. Having some ideas prepared can get the ball rolling and kick off a brainstorming session.
When you’ve taken the time to put together a well-organized report, your board members will naturally be interested in the information. They want to see your organization succeed and are willing to put in the time to make that a reality. The easier you make it for them to grasp what is needed from them, the more engaged they’ll be in your organization’s fundraising efforts.
How to visualize donor data for board decks
Nonprofit board members are usually short on time and inundated with text. To get them to act, your data needs to tell a story at a glance. Poorly chosen charts mask important insights, while the right visual formats expose trends and dangerous outliers immediately. Try these strategies for better visualizations:
1. Use stacked bar and line charts to spot trends.
When showing how donor behavior shifts over time, your visuals should highlight underlying patterns, not just raw totals:
- Donor retention (line chart): Plotting your retention percentage over a three to five-year period quickly shows whether you are building a sustainable base or constantly losing donors. Look for steady upward slopes rather than single-year spikes.
- Giving tiers (stacked bar chart): Instead of a simple total revenue bar, stack each bar by donor segments (e.g., small-dollar, mid-level, major donors). This instantly shows if total revenue is growing healthily across the board, or if you rely on a tiny handful of major gifts to keep the lights on.
2. Use scatter plots and box plots to expose outliers.
Averages (means) can hide severe risks or massive opportunities. Use data distribution charts to expose anomalies:
- Donor lifetime value vs. acquisition cost (scatter plot): Plot individual donor cohorts along two axes. This format lets board members instantly see the "stars" (high lifetime value, low acquisition cost) and outliers who cost more to recruit than they ever give back.
- Gift size distribution (box plot): A box plot visually maps your median gift size alongside your highest and lowest gifts. It exposes skewed data by clearly isolating massive, one-off mega-donations as detached outlier dots far above your typical giving range.
3. Follow visual rules for board decks.
- The five-second rule: If a board member cannot tell whether a chart shows good news or bad news within five seconds, the chart is too complex.
- Ditch standard pie charts: If you are tracking more than three categories, pie charts become a visual mess. Use horizontal bar charts sorted from largest to smallest instead.
- Highlight the "so what?": Use contrasting colors to draw attention directly to the outlier or trend line that requires board intervention.
How often should you report donor data to your board?
Finding the right reporting cadence prevents two common board problems: overwhelming members with weekly data fatigue, or leaving them in the dark until an annual crisis hits. Split your reporting into a predictable quarterly dashboard focused on high-level health indicators, such as trailing 12-month trends, donor retention rates, and progress-to-goal metrics.
Presenting this data on a consistent, single-page visual scorecard every quarter allows board members to quickly spot directional changes and greenlight course corrections before critical year-end fundraising seasons begin.
Once a year, pivot from short-term tracking to a comprehensive annual deep-dive that pulls back the curtain on your long-term fundraising ecosystem. This dedicated session should focus on structural donor behaviors, analyzing complex metrics like donor lifetime value, acquisition costs across different channels, and shifts in giving tiers.
While quarterly reports keep the board informed on immediate fiscal health, the annual retrospective guides your multi-year strategy, capacity building, and budget forecasting without drowning volunteer trustees in monthly transactional noise.
Frequently asked questions about donor data reports for board members
What metrics should you include in a donor data report?
Report donor retention rate, donor lifetime value, giving tiers, and progress toward your annual fundraising goals.
How do you calculate donor retention rate?
Divide the number of returning donors this year by the total number of donors from last year, then multiply by 100.
What is the difference between the mean and the median in donor contributions?
The mean is the calculated average of all gifts. The median is the middle value, which prevents huge, one-off mega-donations from skewing your data.
What should you exclude from the donor report?
Exclude raw transactional logs, private donor identifying details, and noisy month-to-month data fluctuations that distract from high-level strategy.
Wrapping up
You need to prepare your donor data reports for an audience that knows their stuff, even if they’re not fundraising professionals. Board members with less experience with data won’t have the same expectations for your reporting, but they will appreciate the important, unbiased data you can share to help guide their decisions.