infographic
Nonprofit Health and Sustainability Benchmark Survey

Even though sustainability is somewhat of a buzzword in the sector, it is attainable by any nonprofit through just a few key metrics and internal processes.
We were curious whether or not the average nonprofit organization, and the sector as a whole, is on the road to sustainability.
So we surveyed 600 North American nonprofit organizations to see where they stand. The results of the survey can be found in the infographic below:
Methodology
- The survey was open to the public between 2/28/17 and 3/6/17.
- The survey consisted of the following questions:
- Have you defined your top 3 organizational priorities for the current calendar/fiscal year?
- Have you defined your top 3 organizational challenges for the current calendar/fiscal year?
- Are job descriptions in place for every role in your organization?
- Did your organization fully utilize a strategic plan last quarter?
- Did your organization fully utilize a marketing plan last quarter?
- Did your organization fully utilize a succession plan last quarter?
- Did your organization fully utilize a fundraising plan last quarter?
- Did your organization fully utilize a communications plan last quarter to make donors aware of planned giving opportunities?
- Did your organization measure program impact last quarter?
- Did the degree of impact increase?
- Was that impact being reported/communicated externally?
- Have 1/3rd of your volunteers given financially in the past year?
- Have all of your board members pledged or given a gift in the past year?
- Have 3/4ths of your staff given at personally meaningful levels in personally meaningful ways for the past year’s annual gift?
- Number of months of operating cash on hand (excluding restricted funds)
- How many total hours were volunteered last quarter?
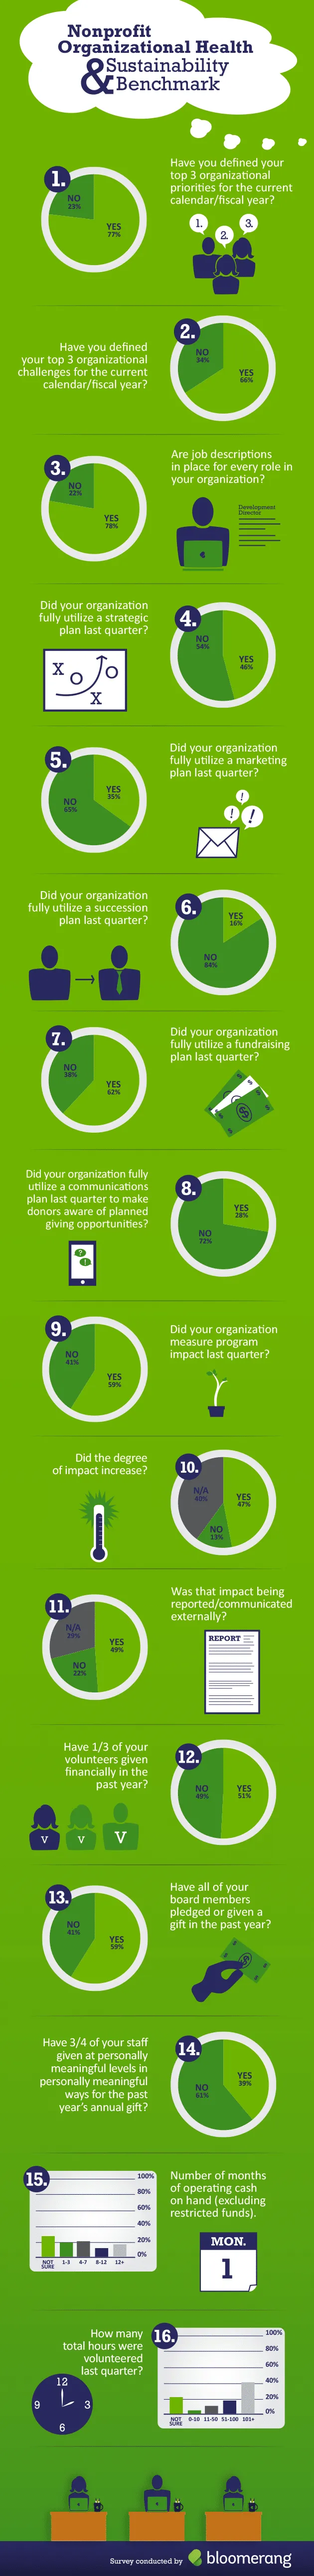
The Data
- 77% have defined their top 3 organizational priorities for the current calendar/fiscal year
- 66% have defined their top 3 organizational challenges for the current calendar/fiscal year
- 78% have job descriptions in place for every role in their organization
- 46% fully utilized a strategic plan last quarter
- 35% fully utilized a marketing plan last quarter
- 16% fully utilized a succession plan last quarter
- 62% fully utilized a fundraising plan last quarter
- 28% fully utilized a communications plan last quarter to make donors aware of planned giving opportunities
- 59% measured program impact last quarter
- 47% of those who measured saw that impact increase
- 49% of those who measured communicated that externally
- 51% saw 1/3rd of their volunteers give financially in the past year
- 59% saw all of their board members pledge or give a gift in the past year
- 39% saw 3/4ths of their staff give at personally meaningful levels in personally meaningful ways for the past year’s annual gift
- Number of months of operating cash on hand (excluding restricted funds):
- Not sure: 28%
- 1-3 months: 21%
- 4-7 months: 21%
- 8-12 months: 12%
- 12+ months: 18%
- Total hours were volunteered last quarter:
- Not sure: 24%
- 0-10: 4%
- 11-50: 10%
- 51-100: 19%
- 101+: 43%
Takeaways
- goal setters: most organizations have organizational priorities and challenges defined
- know your role: most organizations have written job descriptions in place
- not-so-future-proof: few organizations have a succession plan in place
- what gets measured gets improved: almost half of those who measured impact saw that impact increase
- pitching in: almost half of organizations reported at least 101 total hours volunteered last quarter
- room for improvement: board giving is present in more than half of organizations, but just over a third reported healthy staff giving
How does your organization compare to these results? Let us know in the comments below!